Analytics with api.video
August 13, 2020 - Doug Sillars in Analytics, Video Sessions (Analytics)
In the classic movie Field of Dreams, a mysterious voice whispers to Kevin Costner “if you build it, they will come.”
His belief of this statement completely transformed his life and drove him to build a baseball stadium in the middle of a cornfield in Iowa… and they came…
If you Stream it...
You've created some awesome videos, and uploaded them to api.video. Great work - it looks awesome.
Here is a video that we posted in our blog post announcing our new video player:
...Who will come?
Eventually you want to know, how many people came to see my video? What can I learn about them? Enter api.video’s powerful video analytics API. Using the API, we can transfer all of the view data form our videos into our favourite database, and learn about the viewers of our videos.
Let’s start with grabbing the viewing details for a video. In this case, I’ll use this Planets video that my daughter recorded for her class on astronomy:
The url for this video is: https://embed.api.video/vod/vi16NDdXmGxk5QSggW54qw0v
First I must authenticate myself at API.video, and I receive an access token that is good for an hour.
With the token, I can use the videoId to request all of the view information about my video with the analytics API. The videoId for the video is the value at the end of the url (vi16NDdXmGxk5QSggW54qw0v):
curl --request GET  --url
'https://ws.api.video/analytics/videos/vi16NDdXmGxk5QSggW54qw0v?currentPage=1&pageSize=25'
  --header 'accept: application/vnd.api.video+json'
  --header 'authorization: Bearer {my token}'
In this case, I am requesting 25 results per page, and page one of the data. That’s actually fine, since I know there are only 19 views on this video.
The JSON result is pretty long, but here is what one entry looks like:
{
			"session": {
				"sessionId": "psUvkrWcfqhYFUKeHr7RFSK",
				"loadedAt": "2020-06-30T08:16:05+00:00",
				"endedAt": "2020-06-30T08:18:43+00:00"
			},
			"location": {
				"country": "Vietnam",
				"city": "Ho Chi Minh City"
			},
			"referrer": {
				"url": "https://apivideo.github.io/2020/04/03/@api.video-restful-api-explained-e28c0e157c23.html",
				"medium": "unknown",
				"source": "unknown",
				"searchTerm": "unknown"
			},
			"device": {
				"type": "computer",
				"vendor": "unknown",
				"model": "Other"
			},
			"os": {
				"name": "Ubuntu",
				"shortname": "Ubuntu",
				"version": "unknown"
			},
			"client": {
				"type": "unknown",
				"name": "Firefox",
				"version": "77.0"
			}
		},
To me, this is super cool. A person in Vietnam, using Firefox on Ubuntu, watched this video in June! And there are 18 more of these to look at and to parse.
Demo
We have created a demo that takes a videoId and counts the country, device and browser for each view, and places the results on a page. You can try it out at whoswatched.a.video.
In order to look at the data, I am going to suck the JSON file into Couchbase - a database that uses JSON to create a "table" format similar to SQL. This will allow me to run queries on the JSON much like one would run a database query.
Creating a database in Couchbase:
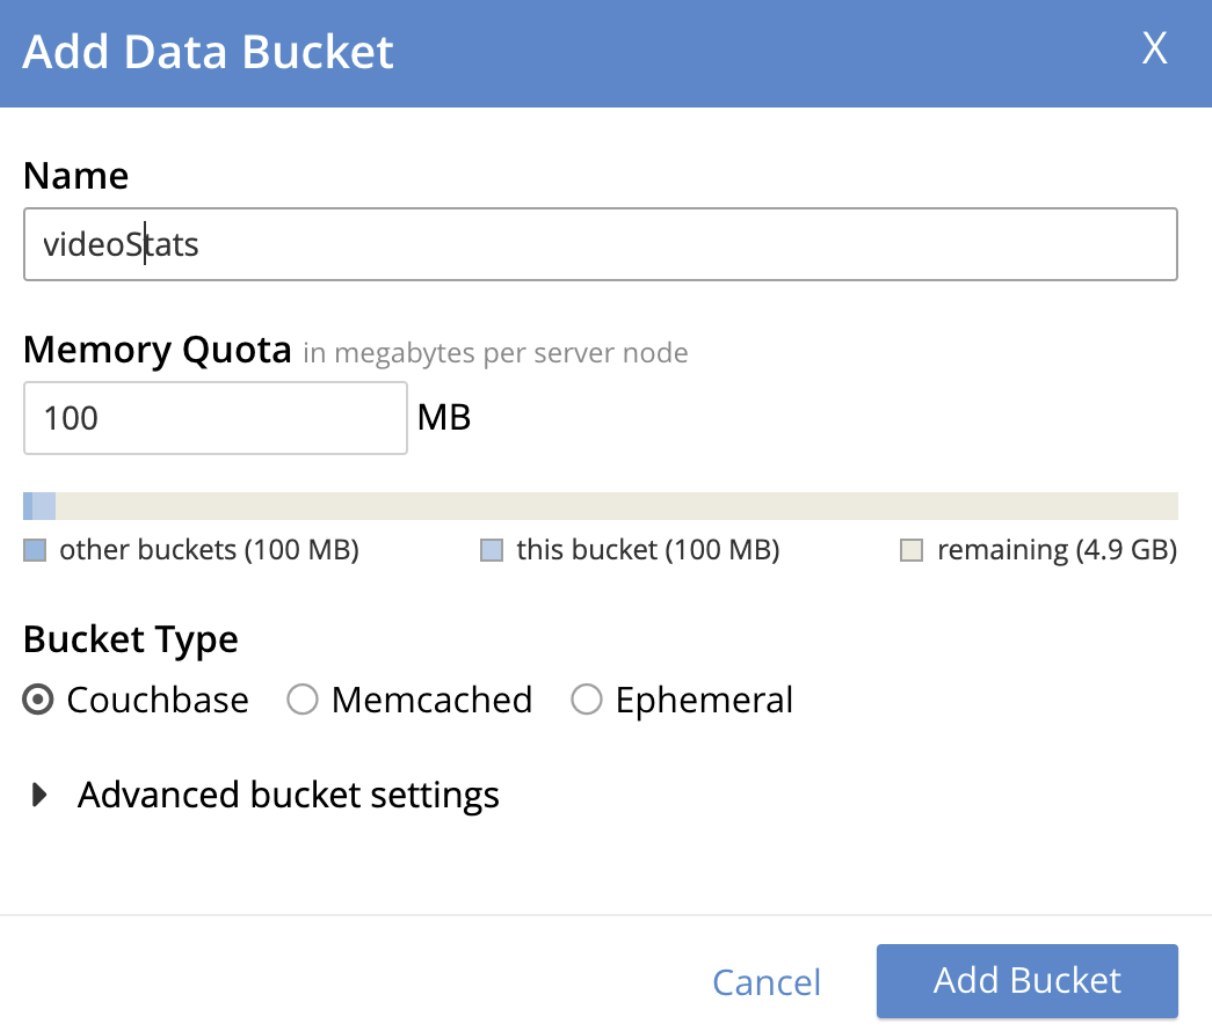
Download and install Couchbase on your computer. When the install is complete, you’ll have an admin dashboard open in your browser (on my Mac it is running on localhost:8901). We’d like to add in our api.video JSON file into a data bucket. To create the bucket - navigate to the Bucket section and click the "ADD BUCKET" button. I have the memory set at the minimum 100 MB (there are all of 19 entries after all!).
Great - now we have our data bucket added. Now we’ll want to import the JSON from api.video, so we can do our analysis. This is done in the terminal using the cbimport command:
./cbimport json -c localhost:8091 -u Administrator -p 123456 \
-b videoStats -d file:///Users/dougsillars/Desktop/json/videodata.json \
-f list -g key::%session.sessionId% -v
My username is Administrator with password 123456 (Google Chrome is mighty peeved about my use of an insecure password on localhost), adding a json file into the videoStats bucket. Each video view has a sessionId, so I use that as a unique key.
I get a success message in my terminal, and looking back at the Couchbase admin panel under Documents, I can see each entry from the JSON has been added:
Now we must index the data. In the Query Editor, enter:
CREATE PRIMARY INDEX ON `videoStats`;
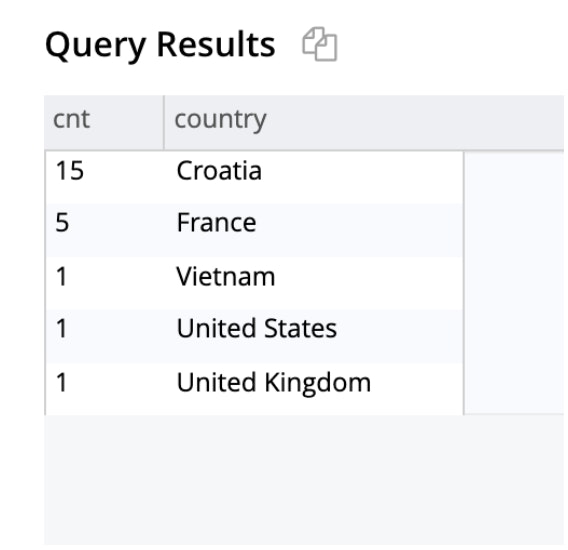
Now we can do data analysis of our video views. For example, to understand the number of views per country:
SELECT DISTINCT(location.country),
       COUNT(location.country) cnt
FROM `videoStats`
GROUP BY location.country
ORDER BY COUNT(location.country) DESC
That’s pretty cool!
Live Stream Analytics
We can do exactly the same thing with live stream analytics. Note: these only show “views” of a live stream. If you run a live stream and no one watches - there will be no analytics reported. Further - if your live streams are saved as video on demand (VOD) for later use - any VOD analytics are saved with the newly created VOD video, and will have no connection to the original live stream.
Let’s look at a live stream that has a number of views. On the api.video homepage, we have a demo that allows you to livestream right from the homepage. The live streamer then “watches” their stream in the browser at the same time that they are broadcasting - guaranteeing that every live stream gets at least one viewer (in the same location as the live streamer!)
The API call is similar to that of the VOD request, I just use the 'live-streams' endpoint as opposed to the 'videos' endpoint I used above.
GeoLocation
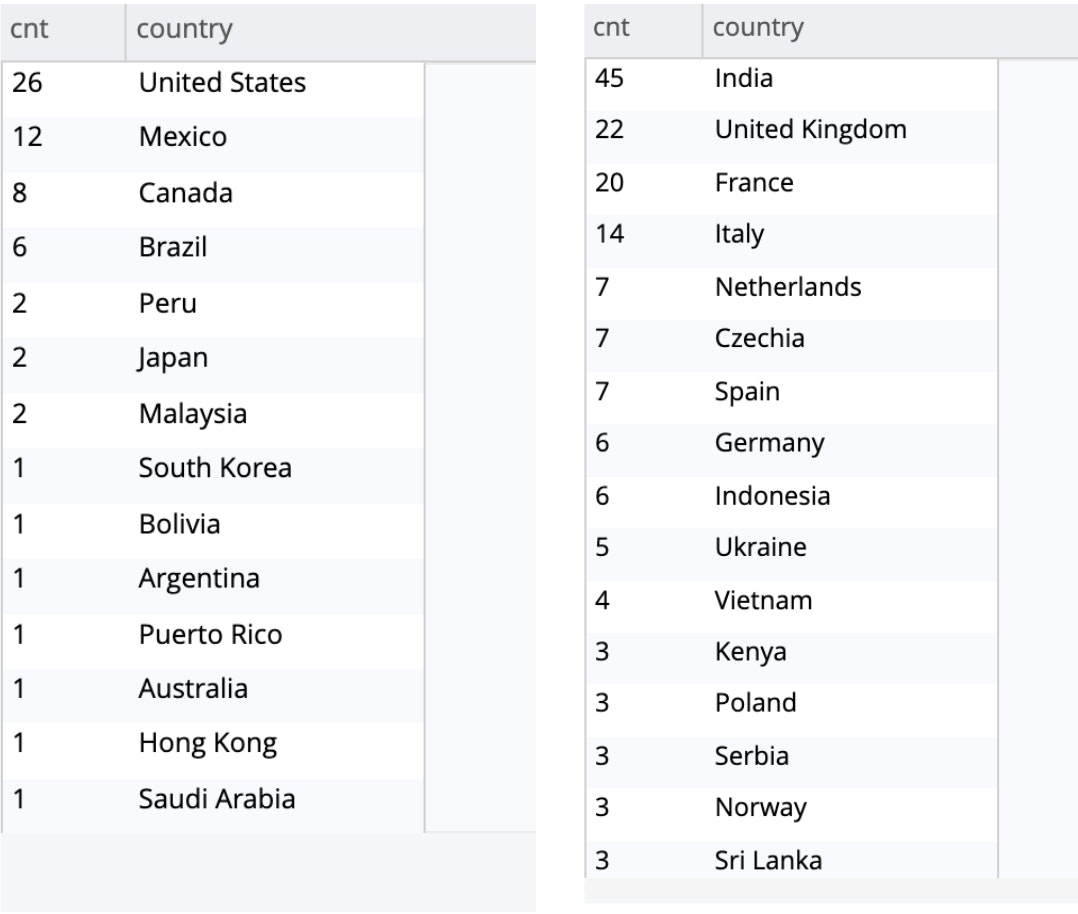
The live stream demo is hosted in North America and in Europe, and we use geolocation to direct our users to the correct server. Let’s see how well our load balancers are doing. Traffic directed to North America is on the left, and European traffic is on the right:
It looks like our load balancing is doing a bang up job. :)
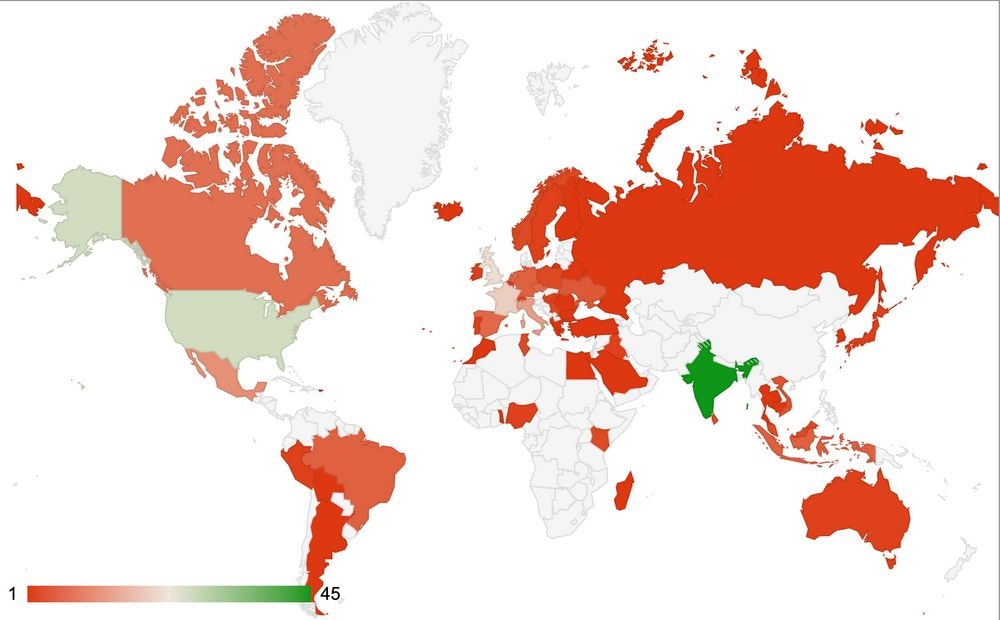
Combining the two sets of data (I just created a new bucket with all the data added) allows us to see that api.video’s home page has been live streaming all around the world:
I placed the Couchbase results in Google Sheets to create this chart.
Devices & browsers
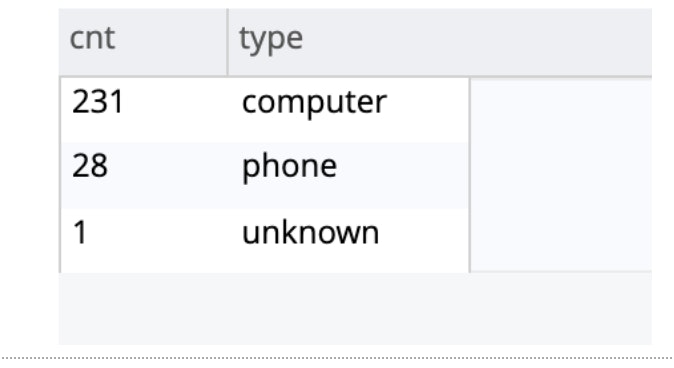
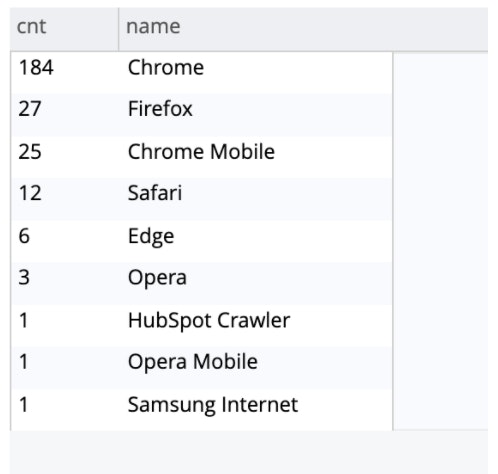
Most of the streams are from desktop machines. All 28 phone instances correspond directly to 28 Android devices.(This is due to a limitation in Safari that prevents the demo from working on any iOS device.) Of our Android users, we see 25 using Chrome, 1 Samsung Internet, 1 Opera (and one hidden variant.)
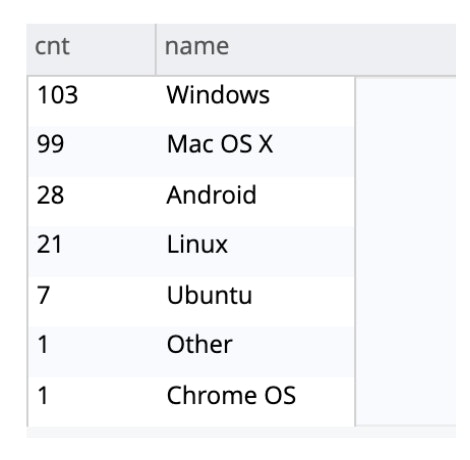
Desktop users are mostly Windows and Mac (and pretty evenly distributed), but also a good number on Linux/Ubuntu).
Conclusion
The video analytics offered by api.video allow you to better understand who is consuming your content. In this post, we've walked through the steps to extract the data using the Analytics API in JSON format, and then ingested the data into a database for fast and easy queries.
We used this data to see how the live stream demo on the api.video home page was used in July 2020.
How are you using api.video's analytics? Drop us a note in the community forum with your use cases!
Follow our latest news by subscribing to our newsletter
Create your free account
Start building with video now

