Api.video Analytics: Build a Choropleth Map (and Find Out What One Is)
April 8, 2021 - Erikka Innes in Analytics, Python, JavaScript
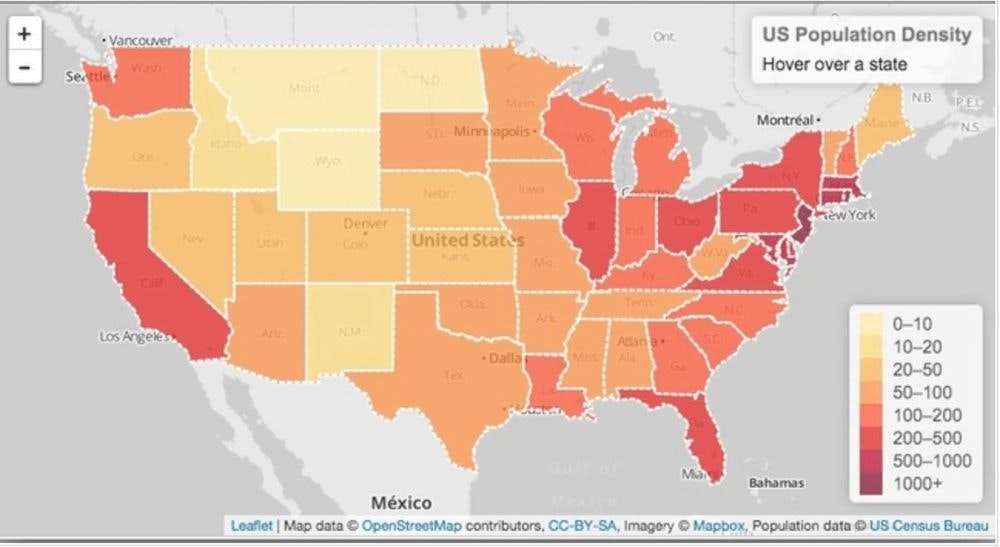
A great way to see at a glance how many viewers you have per country is with a choropleth map. It probably sounds like I'm talking about some weird kind of plant you've never heard of, but chances are you've looked at lots of choropleths before. It's a map that's used to represent statistical data by shading different geographical areas with different colors that represent a certain number of people, items, or whatever else. If you're still a little confused by that explanation, a picture is worth a thousand words, so here's an example of a choropleth map:
The map we're displaying here shows you population density per square mile in the U.S. The value of a choropleth map, is you can quickly understand data. If you had to look at a list of density numbers by state, you might take extra time to scan and find the biggest numbers. With this example map you can see that the darker colors represent higher densities and the lighter colors represent lower densities. Armed with that knowledge you can easily see which states have the highest population densities by color.
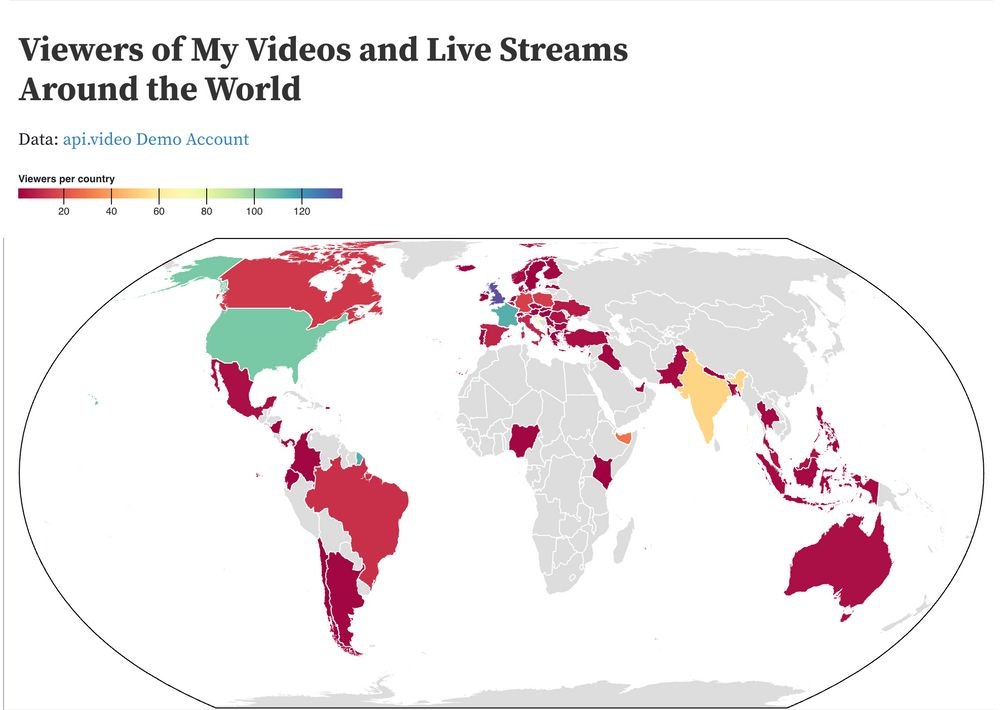
We can create the same kind of map for api.video! In this tutorial, we'll talk about grabbing the data you'll need, and then how to use it with Observable to turn it into a map.
Prerequisites
For this tutorial, you'll need:
- api.video - Sign up here.
- Observable account - Sign up here.
- requests, csv, pycountry, and pandas libraries for Python
Let's start coding!
Retrieving Analytics Data
There are lots of ways to retrieve analytics data, so while we'll post a code sample here, you may want to change it for your data. Some tips to keep in mind are:
- Take a look at a JSON response for analytics before building anything to grab the data. You can see responses here - Tips for Working with api.video Analytics Data. You can also figure out how you want to design everything.
- For Python samples, if you know you have a lot of videos, livestreams, and/or sessions, you will need to handle pagination yourself.
- If you know what you want to do to start with, you can retrieve just that data. We added a few extra things for reference, but otherwise pared down the available data.
- Decide how often you want to update your data.
To keep things simple, this time we're just pulling the data and writing it to a CSV file. In future tutorials, we'll learn how to create a database that periodically updates itself with your analytics data.
Here's the code we used to:
- Get all the analytics data and flatten the JSON. Flattening JSON means taking it out of its nested structure, so each set of information about a video, livestream or a session fits into one row of data.
- Add the three letter country code for every country. If one can't be retrieved because the country is unknown, add '---.'
- If the city or country isn't known, put 'unknown.'
- Add the title to a video or live stream for our reference when reviewing the csv
- Add the assetID and sessionID for our reference when reviewing the csv
- Write a row to a csv file for each session
If you don't like what we choose to extract, you can add or remove by tweaking the code.
import requests
import csv
import pycountry
from opencage.geocoder import OpenCageGeocode

# Get api.video token

url = "https://ws.api.video/auth/api-key"

payload = {"apiKey": "your api key here"}
headers = {
    "Accept": "application/json",
    "Content-Type": "application/json"
}

response = requests.request("POST", url, json=payload, headers=headers)
response = response.json()
token = response.get("access_token")

# Set up Geocoder Authentication
geocoder = OpenCageGeocode('your opencage key here')

# Takes a response from the first query and determines if it's paginated
# Returns data in a list you can iterate over for information for sessions
# or videos and live streams.

def paginated_response(url, token):
    headers = {
    "Accept": "application/json",
    "Authorization": token
    }
    json_response = requests.request("GET", url, headers=headers, params={})
    json_response = json_response.json()
    total_pages = 1
    if json_response is not None:
        total_pages = json_response['pagination']['pagesTotal']
    video_info = list(json_response['data'])
    if total_pages > 1:
        for i in range(2, total_pages +1):
            querystring = {"currentPage":str(i), "pageSize":"25"}
            r = requests.request("GET", url, headers=headers, params=querystring)
            r = r.json()
            video_info = video_info + r['data']
    return video_info

livestreams = paginated_response("https://ws.api.video/live-streams", token)

videos = paginated_response("https://ws.api.video/videos", token)

with open('master_sessions.csv', 'w', newline='') as csv_file:
        fieldnames = ['Title', 'Type', 'AssetID', 'SessionID', 'Loaded', 'Ended', 'Ref_URL', 'Ref_Medium', 'Ref_Source', 'Ref_SearchTerm', 'Device_Type', 'Device_Vendor', 'Device_Model', 'OS_Name', 'OS_Shortname', 'OS_Version', 'Client_Type', 'Client_Name', 'Client_Version', 'Country', 'City', 'ISO_A3', 'Latitude', 'Longitude']
    writer = csv.DictWriter(csv_file, fieldnames)
    writer.writeheader()

    for item in livestreams:
        live_url = 'https://ws.api.video/analytics/live-streams/' + item['liveStreamId']
        title = item['name']
        ID = item['liveStreamId']
        print('when are we arriving here')
        live_sessions = paginated_response(live_url, token)
        for item in live_sessions:
            if item['location']['city'] is None:
                item['location']['city'] = 'unknown'
            if item['location']['country'] is None:
                item['location']['country'] = 'unknown'
            address = item['location']['city'] + ', ' + item['location']['country']
            coords = geocoder.geocode(address)
            lat = coords[0]['geometry']['lat']
            lng = coords[0]['geometry']['lng']
            if item['location']['country'] == 'unknown':
                iso3 = '---'
            if item['location']['country'] != 'unknown':
                iso3 = pycountry.countries.get(name=item['location']['country'])
                if iso3 != None:
                    iso3 = iso3.alpha_3
                else:
                    iso3 = '---'
             writer.writerow({'Title':title, 'Type':'ls', 'AssetID':ID, 'SessionID':record['session']['sessionId'], 'Loaded':record['session']['loadedAt'], 'Ended':record['session']['endedAt'], 'Ref_URL':record['referrer']['url'], 'Ref_Medium':record['referrer']['medium'], 'Ref_Source':record['referrer']['source'], 'Ref_SearchTerm':record['referrer']['searchTerm'], 'Device_Type':record['device']['type'], 'Device_Vendor':record['device']['vendor'], 'Device_Model':record['device']['model'], 'OS_Name':record['os']['name'], 'OS_Shortname':record['os']['shortname'], 'OS_Version':record['os']['version'], 'Client_Type':record['client']['type'], 'Client_Name':record['client']['name'], 'Client_Version':record['client']['version'], 'Country':record['location']['country'], 'City':record['location']['city'], 'ISO_A3':iso3, 'Latitude':lat, 'Longitude':lng})


    for item in videos:
        video_url = 'https://ws.api.video/analytics/videos/' + item['videoId']
        title = item['title']
        ID = item['videoId']
        video_sessions = paginated_response(video_url, token)
        for item in video_sessions:
            if item['location']['city'] is None:
                item['location']['city'] = 'unknown'
            if item['location']['country'] is None:
                item['location']['country'] = 'unknown'
            address = item['location']['city'] + ', ' + item['location']['country']
            coords = geocoder.geocode(address)
            lat = coords[0]['geometry']['lat']
            lng = coords[0]['geometry']['lng']
            if item['location']['country'] == 'unknown':
                iso3 = '---'
            if item['location']['country'] != 'unknown':
                iso3 = pycountry.countries.get(name=item['location']['country'])
                if iso3 != None:
                    iso3 = iso3.alpha_3
                else:
                    iso3 = '---'
            writer.writerow({'Title':title, 'Type':'ls', 'AssetID':ID, 'SessionID':record['session']['sessionId'], 'Loaded':record['session']['loadedAt'], 'Ended':record['session']['endedAt'], 'Ref_URL':record['referrer']['url'], 'Ref_Medium':record['referrer']['medium'], 'Ref_Source':record['referrer']['source'], 'Ref_SearchTerm':record['referrer']['searchTerm'], 'Device_Type':record['device']['type'], 'Device_Vendor':record['device']['vendor'], 'Device_Model':record['device']['model'], 'OS_Name':record['os']['name'], 'OS_Shortname':record['os']['shortname'], 'OS_Version':record['os']['version'], 'Client_Type':record['client']['type'], 'Client_Name':record['client']['name'], 'Client_Version':record['client']['version'], 'Country':record['location']['country'], 'City':record['location']['city'], 'ISO_A3':iso3, 'Latitude':lat, 'Longitude':lng})
We will be using the file we generate to create the choropleth.
After you run the code sample, you should have a csv file that contains details about all of your video and live stream sessions. It takes awhile to run if you have a lot of data, so if it seems like it's stuck, it's not. It can take upwards of 15 minutes if you have lots of data to crunch through. Take a break or work on something else while everything is retrieved.
Add Your CSV to a Pandas DataFrame
The next step is to take your CSV file and convert it into a pandas dataframe. Pandas is a software library used for data science activities. It makes it easier to do a lot of time consuming, repetitive tasks you need to do with data like cleansing, performing mathematical operations on columns, filling information in, removing data, inspecting it, and lots more. It also has a steep learning curve, but don't worry if you've never used it, we're providing a code snippet for working with it.
import pandas as pd

df = pd.read_csv("master_data.csv")

df_grouped = df.groupby(['ISO_A3']).agg(Count=pd.NamedAgg(column="City", aggfunc="count"))

df_grouped.to_csv('choro.csv')
In this code snippet, we create a dataframe in pandas. Then we drop everything and grooup information so we get a table in CSV format with two columns: ISO_A3 and Count. That's all we need for our map! If you need to get the data back, it's still in your CSV file and you can use it in pandas to group information however you want.
We're going to use this new csv file- 'choro.csv'- to build our choropleth.
Configure Your Choropleth in Observable
Here's where we walk through using Observable. We're going to switch over to using something similar to JavaScript. Most of it's set up for you, and the sample map we've created will show you where your data goes.
- Navigate to Observable and log in (or sign up if you didn't already).
- Navigate to my sample choropleth (built from Mike Bostock's cool Hospital Beds choropleth).
- Get the final CSV file generated with the instructions (for Python) - 'choro.csv'
- Click the three dots in the upper right corner. Click Fork. You want to do it this way, so you get this version of the file and not the original hospital beds map. We've tweaked a couple of things, and if you don't want to do tweaks yourself and instead see everything work as described, you want to fork this project.
- Click the three dots again. Click File attachments. You'll open an upload panel.
- Click Upload.
- Browse for your copy of 'choro.csv' and upload it.
- Run everything, it should work and show you a map. Based on how many viewers you have, this implementation will automatically divide everything into colors on the scale displayed at the top.
You can make your own version of the map and then publish a notebook that you can share anywhere, showing off a beautiful map of where you have the most viewers!
Erikka Innes
Developer Evangelist
Follow our latest news by subscribing to our newsletter
Create your free account
Start building with video now


